# seven random values
data = d3.range(7).map (d) -> { category: "cat_#{d}", value: Math.random() }

max = d3.max(data, (d) -> d.value)

width = 960
height = 500
side = Math.min(width,height)
RADIUS = side / 4 - 20


svg = d3.select("body").append("svg")
    .attr("width", width)
    .attr("height", height)
  .append('g')
    .attr
      transform: "translate(#{width/2}, #{height/2})"

ul = svg.append("g")
    .attr
      transform: "translate(#{-side/4}, #{-side/4})"

ur = svg.append("g")
    .attr
      transform: "translate(#{+side/4}, #{-side/4})"

bl = svg.append("g")
    .attr
      transform: "translate(#{-side/4}, #{+side/4})"

br = svg.append("g")
    .attr
      transform: "translate(#{+side/4}, #{+side/4}) rotate(180)" # bubble ordering is rotated by 180 degrees

color = d3.scale.ordinal()
  .domain(data.map (d) -> d.category)
  .range(["#1b9e77","#d95f02","#7570b3","#e7298a","#66a61e","#e6ab02","#a6761d","#666666"])

# ---------
# bar chart
# ---------

y_scale = d3.scale.linear()
  .domain([0, max])
  .range([0, 2*RADIUS])

x_scale = d3.scale.ordinal()
  .domain(data.map (d) -> d.category)
  .rangeRoundBands([-RADIUS, RADIUS], .05)

bars = ul.selectAll('.bar')
  .data(data)

bars.enter().append('rect')
  .attr
    class: 'bar'
    x: (d) -> x_scale(d.category)
    y: (d) -> RADIUS-y_scale(d.value)
    width: x_scale.rangeBand()
    height: (d) -> y_scale(d.value)
    fill: (d) -> color(d.category)

# ---------
# pie chart
# ---------

pie = d3.layout.pie()
  .sort(null)
  .value((d) -> d.value )

arc_generator = d3.svg.arc()
  .innerRadius(0)
  .outerRadius(RADIUS)

ur.selectAll('.arc')
    .data(pie(data))
  .enter().append('path')
    .attr
      class: 'arc'
      d: arc_generator
      fill: (d) -> color(d.data.category)

# -----------------
# one-level treemap
# -----------------

treemap = d3.layout.treemap()
  .size([2*RADIUS, 2*RADIUS])
  .value((node) -> node.value)
  .sort((a,b) -> d3.descending(a.category,b.category))

tree = {
  children: data
}
nodes = treemap.nodes(tree)

bl.selectAll('.node')
    .data(nodes.filter (node) -> node.depth is 1 )
  .enter().append('rect')
    .attr
      class: 'node'
      x: (node) -> node.x - RADIUS
      y: (node) -> node.y - RADIUS
      width: (node) -> node.dx
      height: (node) -> node.dy
      fill: (d) -> color(d.category)

# ------------
# bubble chart
# ------------

pack = d3.layout.pack()
  .size([2.4*RADIUS, 2.4*RADIUS])
  .value((node) -> node.value)
  .sort((a,b) -> d3.descending(a.category,b.category))
  .padding(2)

pack_tree = {
  children: data
}
pack_nodes = pack.nodes(pack_tree)

br.selectAll('.bubble')
    .data(nodes.filter (node) -> node.depth is 1 )
  .enter().append('circle')
    .attr
      class: 'bubble'
      cx: (node) -> node.x - 1.2*RADIUS
      cy: (node) -> node.y - 1.2*RADIUS
      r: (node) -> node.r
      fill: (d) -> color(d.category)
(function() {
  var RADIUS, arc_generator, bars, bl, br, color, data, height, max, nodes, pack, pack_nodes, pack_tree, pie, side, svg, tree, treemap, ul, ur, width, x_scale, y_scale;

  data = d3.range(7).map(function(d) {
    return {
      category: "cat_" + d,
      value: Math.random()
    };
  });

  max = d3.max(data, function(d) {
    return d.value;
  });

  width = 960;

  height = 500;

  side = Math.min(width, height);

  RADIUS = side / 4 - 20;

  svg = d3.select("body").append("svg").attr("width", width).attr("height", height).append('g').attr({
    transform: "translate(" + (width / 2) + ", " + (height / 2) + ")"
  });

  ul = svg.append("g").attr({
    transform: "translate(" + (-side / 4) + ", " + (-side / 4) + ")"
  });

  ur = svg.append("g").attr({
    transform: "translate(" + (+side / 4) + ", " + (-side / 4) + ")"
  });

  bl = svg.append("g").attr({
    transform: "translate(" + (-side / 4) + ", " + (+side / 4) + ")"
  });

  br = svg.append("g").attr({
    transform: "translate(" + (+side / 4) + ", " + (+side / 4) + ") rotate(180)"
  });

  color = d3.scale.ordinal().domain(data.map(function(d) {
    return d.category;
  })).range(["#1b9e77", "#d95f02", "#7570b3", "#e7298a", "#66a61e", "#e6ab02", "#a6761d", "#666666"]);

  y_scale = d3.scale.linear().domain([0, max]).range([0, 2 * RADIUS]);

  x_scale = d3.scale.ordinal().domain(data.map(function(d) {
    return d.category;
  })).rangeRoundBands([-RADIUS, RADIUS], .05);

  bars = ul.selectAll('.bar').data(data);

  bars.enter().append('rect').attr({
    "class": 'bar',
    x: function(d) {
      return x_scale(d.category);
    },
    y: function(d) {
      return RADIUS - y_scale(d.value);
    },
    width: x_scale.rangeBand(),
    height: function(d) {
      return y_scale(d.value);
    },
    fill: function(d) {
      return color(d.category);
    }
  });

  pie = d3.layout.pie().sort(null).value(function(d) {
    return d.value;
  });

  arc_generator = d3.svg.arc().innerRadius(0).outerRadius(RADIUS);

  ur.selectAll('.arc').data(pie(data)).enter().append('path').attr({
    "class": 'arc',
    d: arc_generator,
    fill: function(d) {
      return color(d.data.category);
    }
  });

  treemap = d3.layout.treemap().size([2 * RADIUS, 2 * RADIUS]).value(function(node) {
    return node.value;
  }).sort(function(a, b) {
    return d3.descending(a.category, b.category);
  });

  tree = {
    children: data
  };

  nodes = treemap.nodes(tree);

  bl.selectAll('.node').data(nodes.filter(function(node) {
    return node.depth === 1;
  })).enter().append('rect').attr({
    "class": 'node',
    x: function(node) {
      return node.x - RADIUS;
    },
    y: function(node) {
      return node.y - RADIUS;
    },
    width: function(node) {
      return node.dx;
    },
    height: function(node) {
      return node.dy;
    },
    fill: function(d) {
      return color(d.category);
    }
  });

  pack = d3.layout.pack().size([2.4 * RADIUS, 2.4 * RADIUS]).value(function(node) {
    return node.value;
  }).sort(function(a, b) {
    return d3.descending(a.category, b.category);
  }).padding(2);

  pack_tree = {
    children: data
  };

  pack_nodes = pack.nodes(pack_tree);

  br.selectAll('.bubble').data(nodes.filter(function(node) {
    return node.depth === 1;
  })).enter().append('circle').attr({
    "class": 'bubble',
    cx: function(node) {
      return node.x - 1.2 * RADIUS;
    },
    cy: function(node) {
      return node.y - 1.2 * RADIUS;
    },
    r: function(node) {
      return node.r;
    },
    fill: function(d) {
      return color(d.category);
    }
  });

}).call(this);
File not shown (binary encoding).
 27 October, 2014
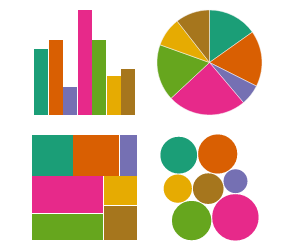